
In my previous post I covered how to get Netdata up and running and tour its dashboards. But monitoring without alerting is just a pretty graph you'll never look at until something breaks. Let's fix that.
Netdata ships with 200+ pre-configured health checks out of the box. All you need to do is wire up a notification channel — and it takes about 10 minutes.
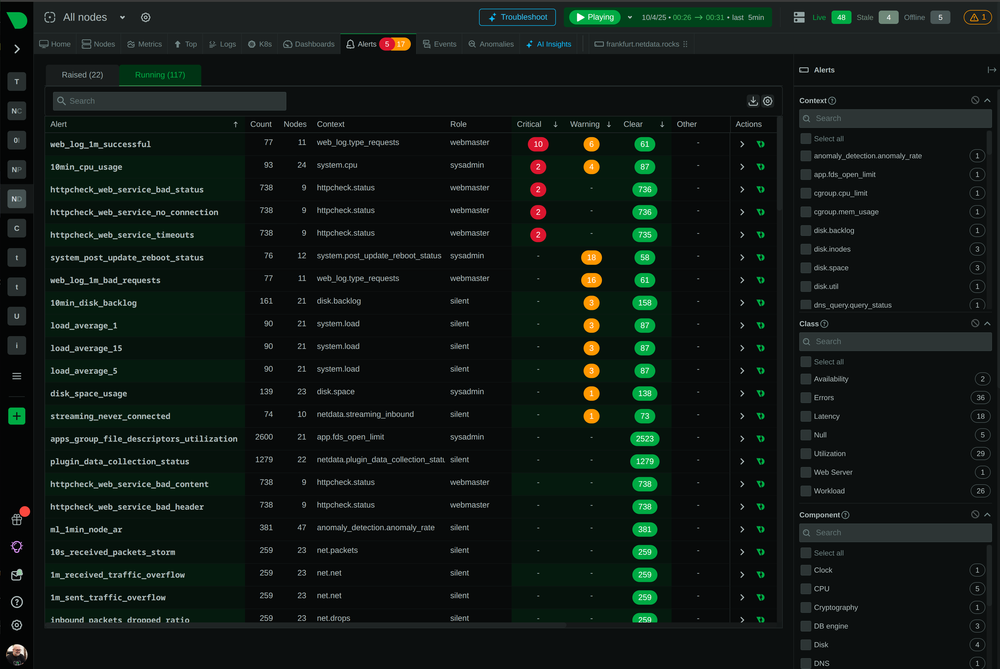
How Netdata Alerts Work
Netdata evaluates health checks locally on each agent. When a threshold is breached (e.g., CPU > 90% for 1 minute), it fires an alert and calls your configured notifier. No cloud dependency required.
There are two paths to know:
/usr/lib/netdata/conf.d/health_alarm_notify.conf  ← default reference (read-only)
/etc/netdata/health_alarm_notify.conf              ← your override (edit this one)
/etc/netdata/health.d/                             ← custom alert rules go here
To peek at the defaults before editing anything:
docker exec netdata cat /usr/lib/netdata/conf.d/health_alarm_notify.confOption 1: Email Notifications
The simplest setup. Drop into the container and create your override:
docker exec -it netdata bash
nano /etc/netdata/health_alarm_notify.conf
Set:
SEND_EMAIL="YES"
DEFAULT_RECIPIENT_EMAIL="you@example.com"
Test it:
docker exec netdata /usr/libexec/netdata/plugins.d/alarm-notify.sh test emailOption 2: Telegram (my favourite)
Free, instant, no open ports needed. Perfect for homelabs.
Step 1: Create a bot — message @BotFather on Telegram and run /newbot. Copy the API token.
Step 2: Get your Chat ID — message your bot anything, then open:
https://api.telegram.org/bot<YOUR_TOKEN>/getUpdatesLook for "chat":{"id": — that number is your chat ID.
Step 3: Configure Netdata
docker exec -it netdata bash
nano /etc/netdata/health_alarm_notify.conf
Set:
SEND_TELEGRAM="YES"
TELEGRAM_BOT_TOKEN="your-token-here"
DEFAULT_RECIPIENT_TELEGRAM="your-chat-id"
Test it:
docker exec netdata /usr/libexec/netdata/plugins.d/alarm-notify.sh test telegramOption 3: PagerDuty (for production setups)
In PagerDuty: create a new service → integration → select "Netdata" → copy the Integration Key.
Then in /etc/netdata/health_alarm_notify.conf:
SEND_PD="YES"
PD_SERVICE_KEY="your-integration-key-here"
Test:
docker exec netdata /usr/libexec/netdata/plugins.d/alarm-notify.sh test pdCustomizing Alert Thresholds
Create a file in /etc/netdata/health.d/:
docker exec -it netdata bash
nano /etc/netdata/health.d/custom_cpu.conf
Example — warn at 75%, critical at 90%:
alarm: cpu_usage_custom
on: system.cpu
lookup: average -1m unaligned of user,system,softirq,irq,guest
units: %
every: 1m
warn: $this > 75
crit: $this > 90
info: CPU usage is high
to: sysadmin
Restart to apply:
docker restart netdataQuick Reference
| Channel | Best For | Cost |
|---|---|---|
| Simple setups | Free | |
| Telegram | Homelabs, personal | Free |
| PagerDuty | Production, on-call | Paid |
| Slack | Team environments | Free tier |
| Discord | Communities, homelabs | Free |
Wrapping Up
You already have the metrics. Adding a notifier takes 10 minutes and saves you from finding out your server is down via a user complaint.
My setup: Telegram for the homelab, PagerDuty for anything customer-facing.
If you're not on Netdata yet, grab 10% off a Pro plan with my referral link
Already running Netdata? Upgrade to Pro and get extended retention,
SSO, and team management — 10% off with my referral link.
