
Netdata is a lightweight monitoring solution that provides real-time insights into your systems, containers, and services. This guide covers its core features, installation methods, and practical usage examples with real dashboards.
Table of Contents
What is Netdata
Netdata is an open-source, high-resolution monitoring agent that provides real-time performance insights into your infrastructure.

Designed for system administrators, DevOps engineers, and developers, Netdata offers out-of-the-box observability for systems, containers, applications, and services — with minimal setup and extremely low overhead.
It can be deployed on physical or virtual servers, in containers, or even on edge devices. Netdata collects thousands of metrics per second and visualizes them via an interactive dashboard or centralized cloud interface.
Key Features
Real-Time, Per-Second Monitoring
Netdata streams live data instantly. You get updates every second with no delay, which makes it ideal for spotting short-lived spikes or anomalies.
Automatic Service Detection
Netdata auto-discovers hundreds of services: systemd, Nginx, Apache, Redis, MySQL, PostgreSQL, Docker, Kubernetes, and more — no config required.
Pre-Built Dashboards
Metrics are visualized in powerful, interactive dashboards that require no setup. You can navigate by node, container, process, or metric type.
Health Monitoring and Alerts
Netdata comes with over 200 pre-configured health checks and supports alerting via Slack, Discord, email, PagerDuty, and others. Alerts are evaluated locally per node.
Distributed and Scalable
Each Netdata agent runs independently and communicates securely with Netdata Cloud — a central interface to monitor all your nodes globally.
Minimal Overhead
Netdata is written in C and optimized for low resource usage. It runs continuously on production systems without impacting performance.
Extensible and Scriptable
Custom collectors, plugins, and alarms can be added via Python, Go, BASH, or Node.js. It also integrates with Prometheus, Graphite, and OpenTSDB.
How to Install Netdata
Option 1: Kickstart Script (recommended for Linux systems)
bash <(curl -Ss https://my-netdata.io/kickstart.sh)This command installs the Netdata agent and launches the dashboard at http://your-ip:19999.
Option 2: Docker (standalone)
docker run -d \
  --name=netdata \
  -p 19999:19999 \
  -v netdataconfig:/etc/netdata \
  -v netdatalib:/var/lib/netdata \
  -v /proc:/host/proc:ro \
  -v /sys:/host/sys:ro \
  -v /etc/os-release:/host/etc/os-release:ro \
  --cap-add SYS_PTRACE \
  --security-opt apparmor=unconfined \
  netdata/netdata
Option 3: Docker Compose (for stack integration)
version: "3"
services:
  netdata:
    image: netdata/netdata:latest
    container_name: netdata
    ports:
      - "19999:19999"
    cap_add:
      - SYS_PTRACE
    security_opt:
      - apparmor=unconfined
    volumes:
      - netdataconfig:/etc/netdata
      - netdatalib:/var/lib/netdata
      - /etc/os-release:/host/etc/os-release:ro
      - /proc:/host/proc:ro
      - /sys:/host/sys:ro
    restart: unless-stopped

volumes:
  netdataconfig:
  netdatalib:
Real Dashboards and Metrics (with Examples)
Netdata’s dashboards offer an immediate look into your system's state. Below are examples from a live node running real workloads.
System Overview
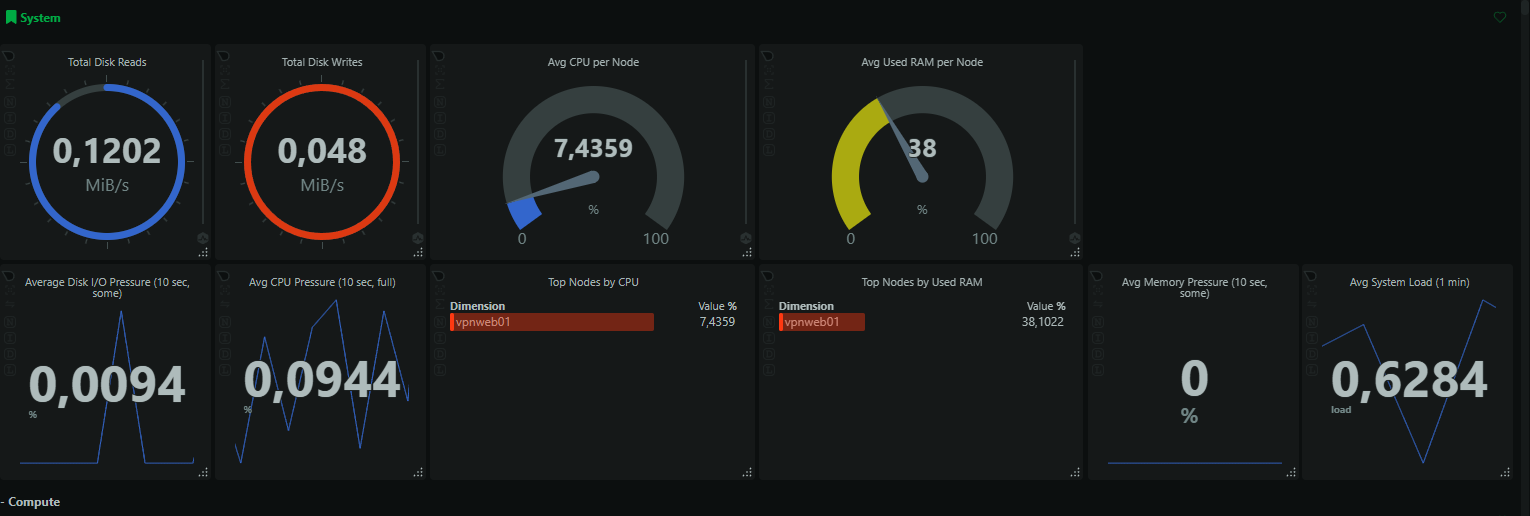
Live CPU, disk I/O, RAM usage, and system pressure are shown in real time.
Memory Insights
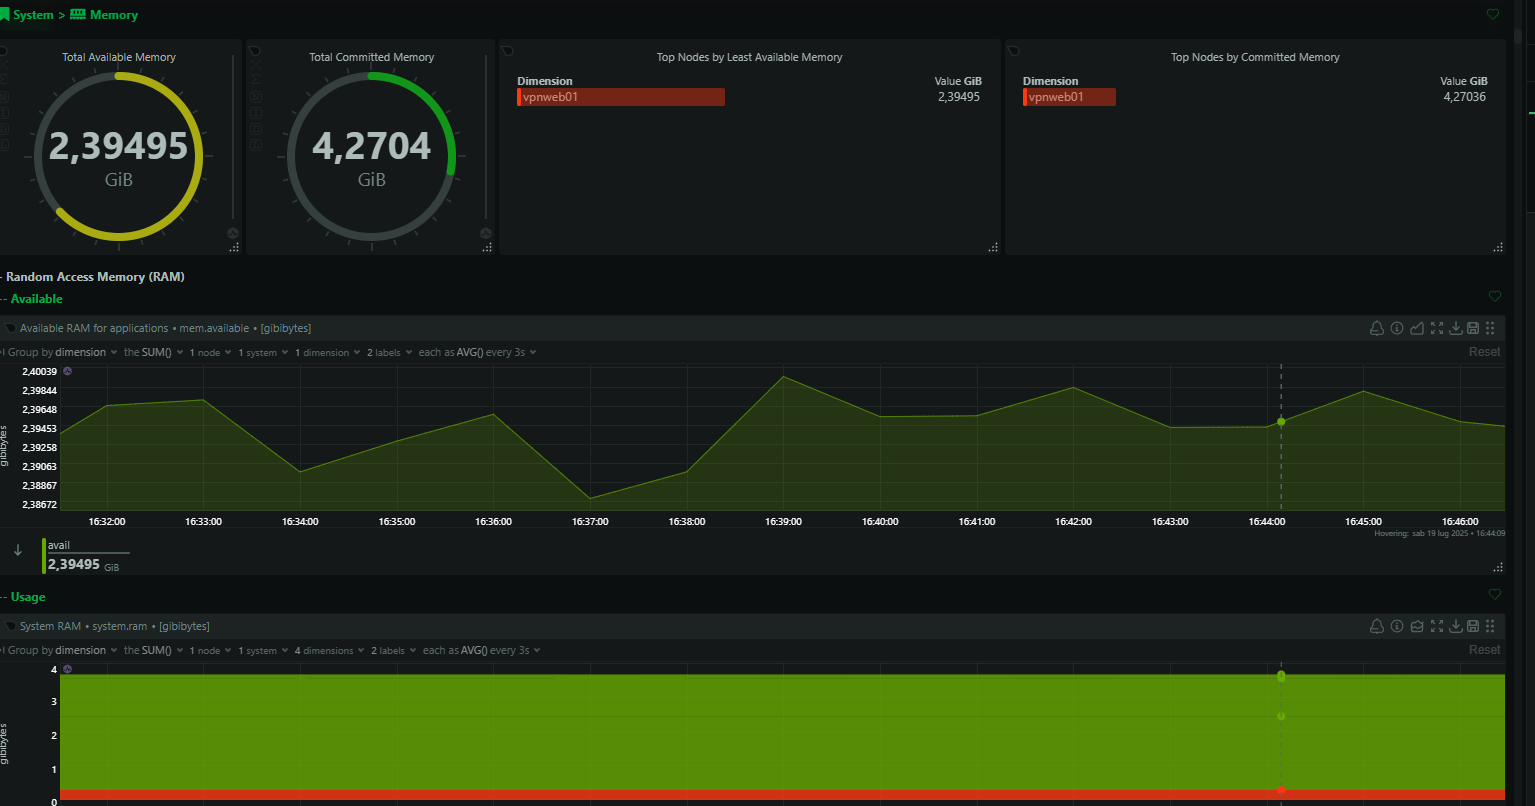
Visualize available and committed RAM. Useful for detecting memory leaks and overcommitted systems.
Disk I/O Details
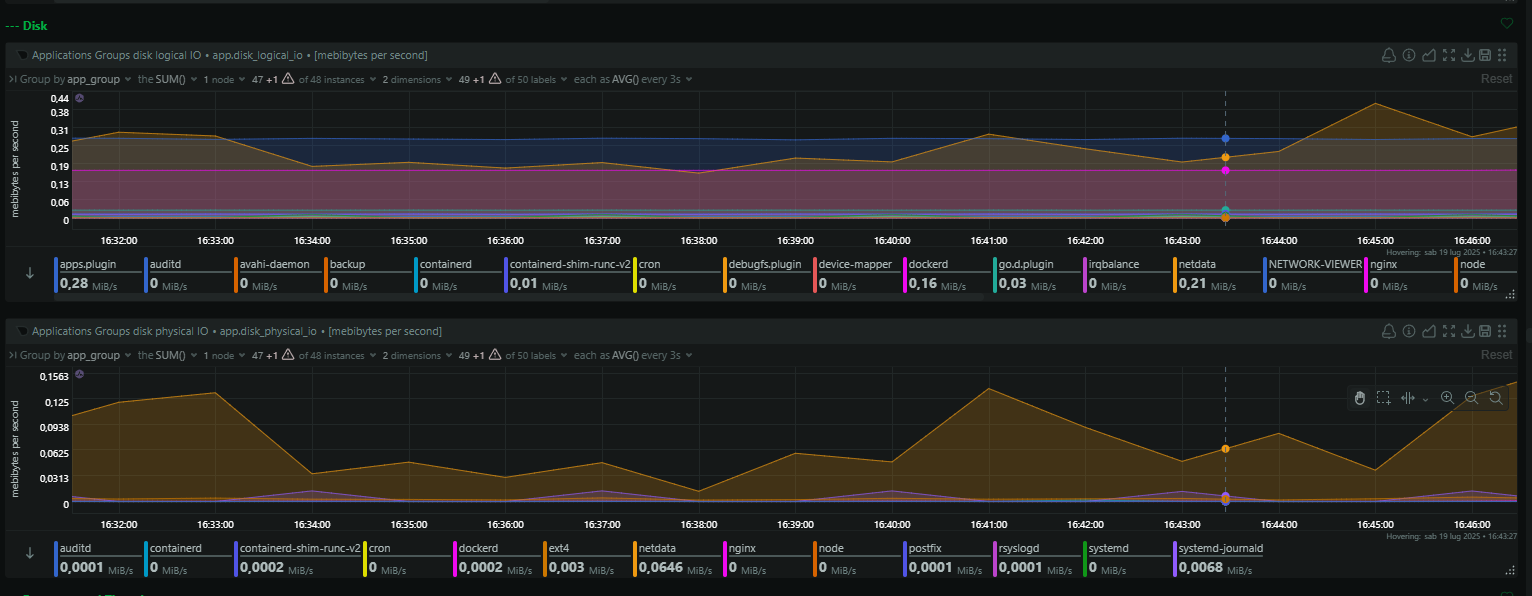
Drill down into per-application disk activity.
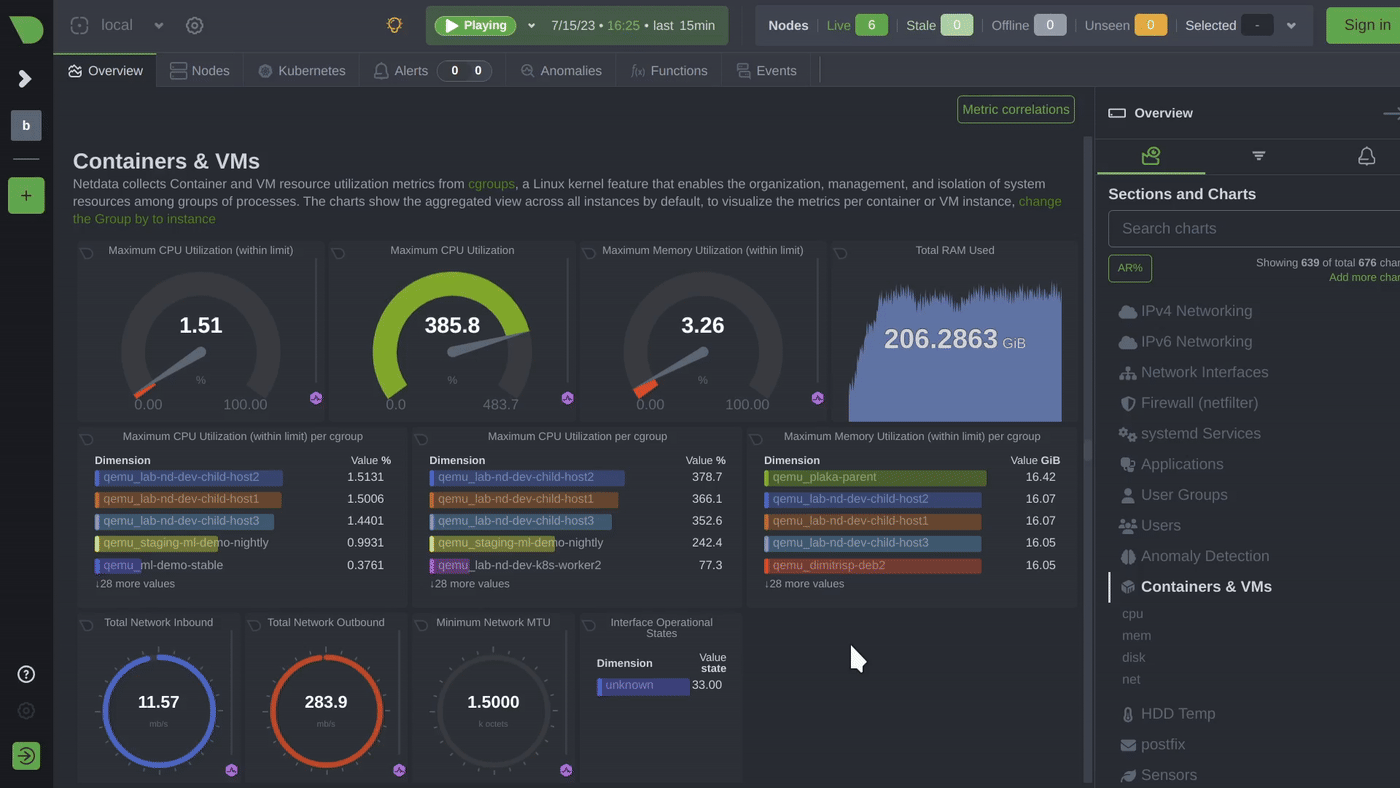
Container Resource Usage
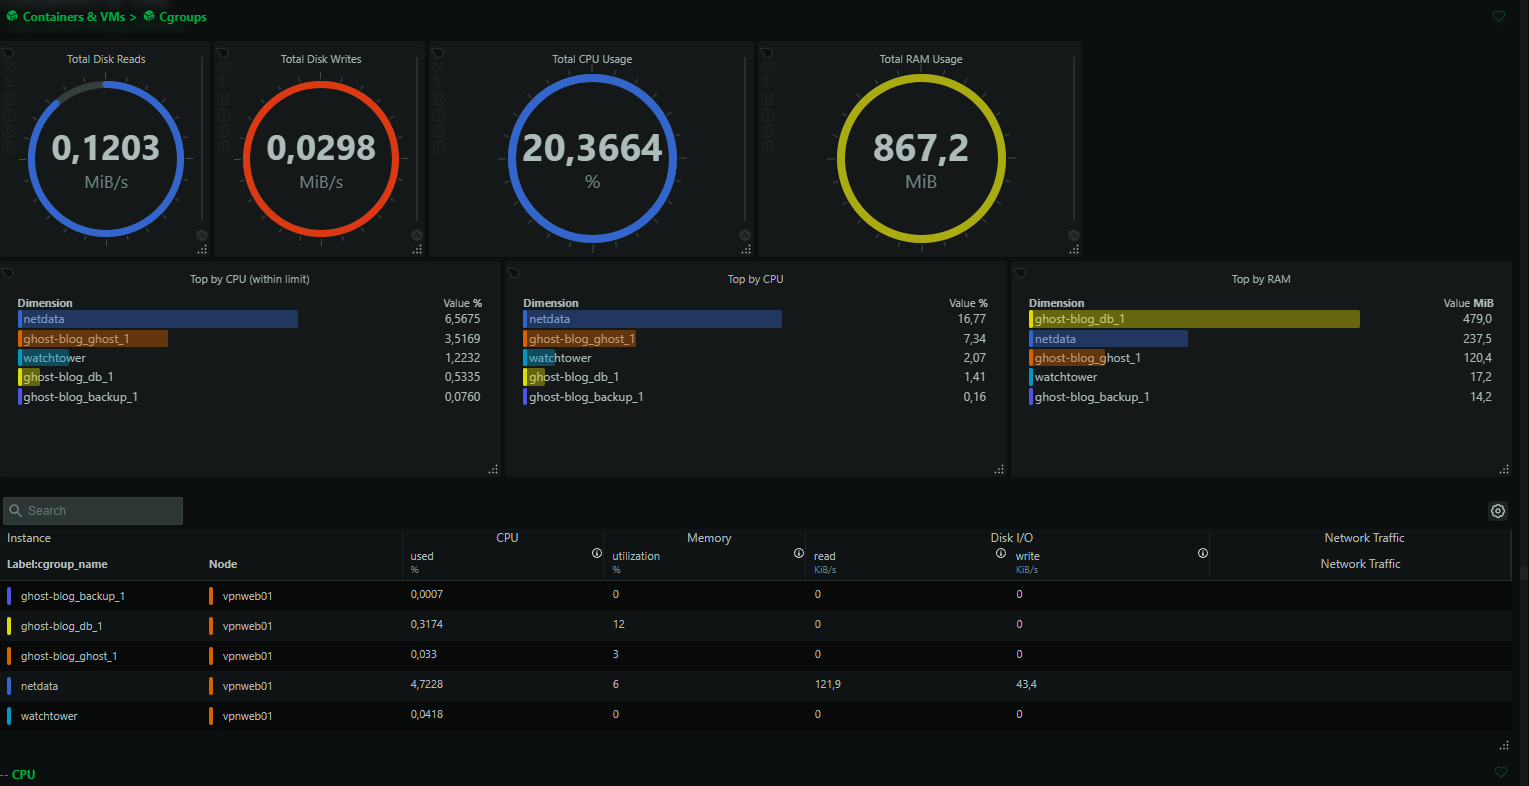
Netdata detects all Docker containers and shows CPU, memory, and I/O usage per cgroup.
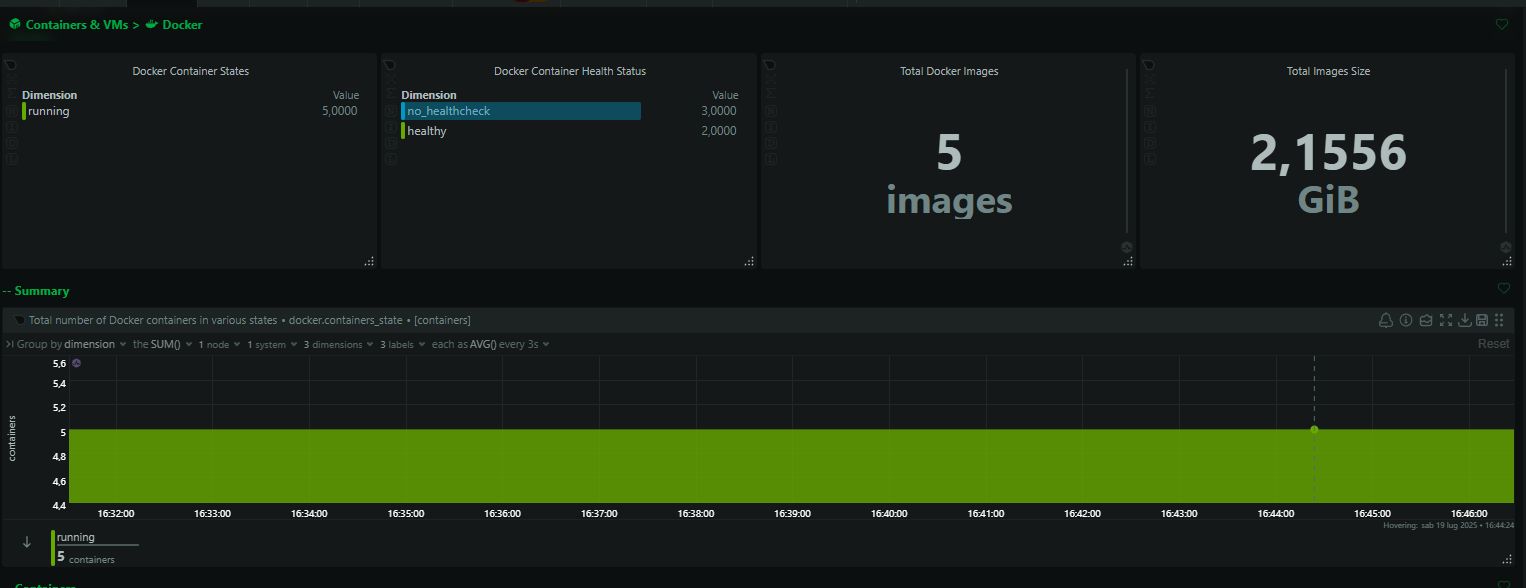
Track container states, image sizes, and total usage.
Optional: Running Netdata in Docker or Compose
While Netdata is most effective when installed directly on the host (for full metric access), it also works inside Docker if mounted correctly.
Use Compose for ease of management in stack-based setups, or run standalone in isolated environments. Ensure you mount /proc, /sys, and /etc/os-release for proper metric visibility.
Troubleshooting and Diagnostics
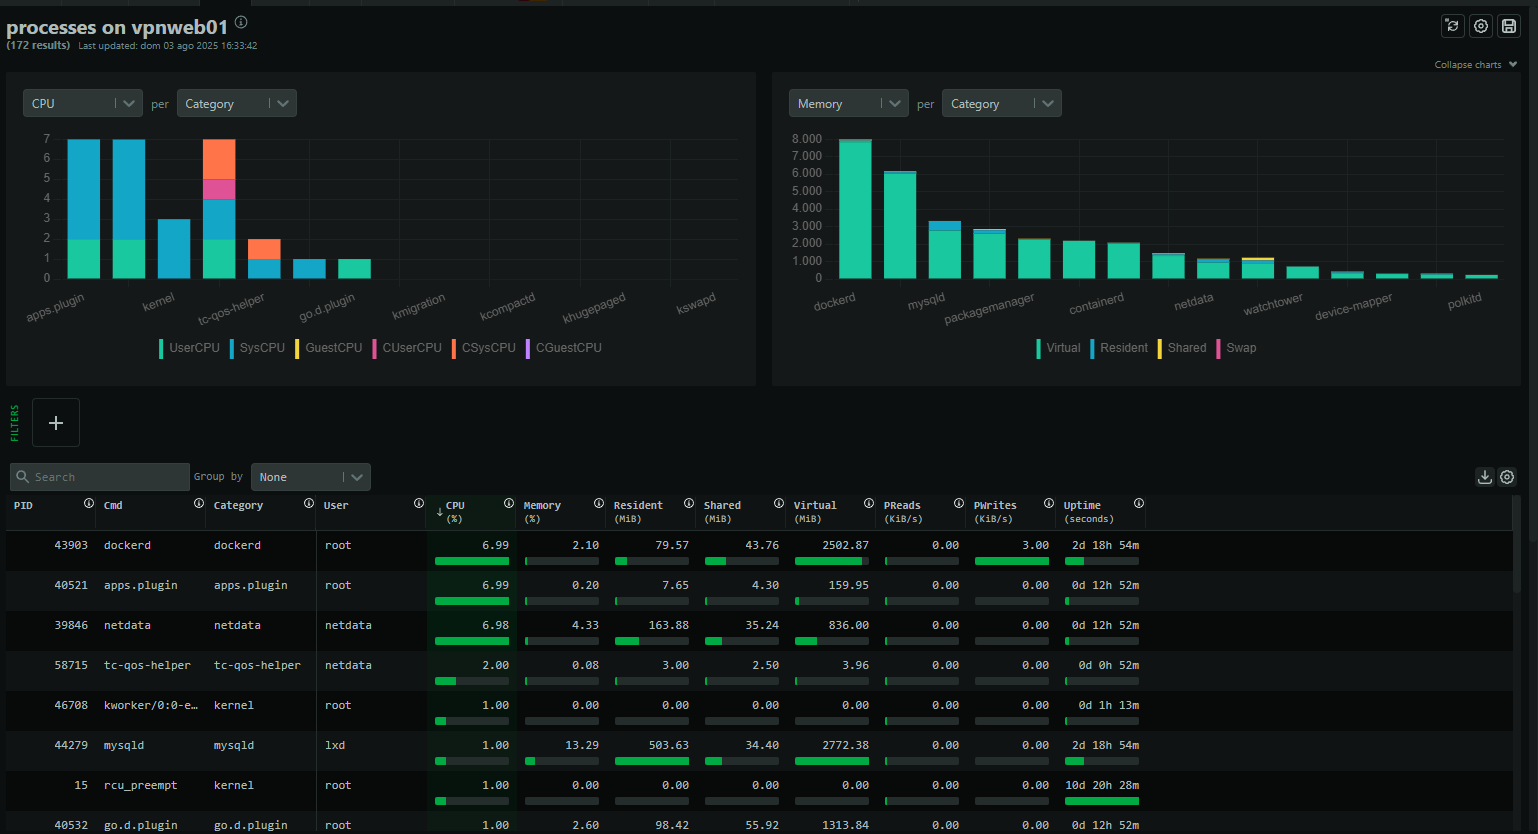
Process Monitoring
Inspect per-process CPU, memory, and disk I/O usage.
Log Visibility
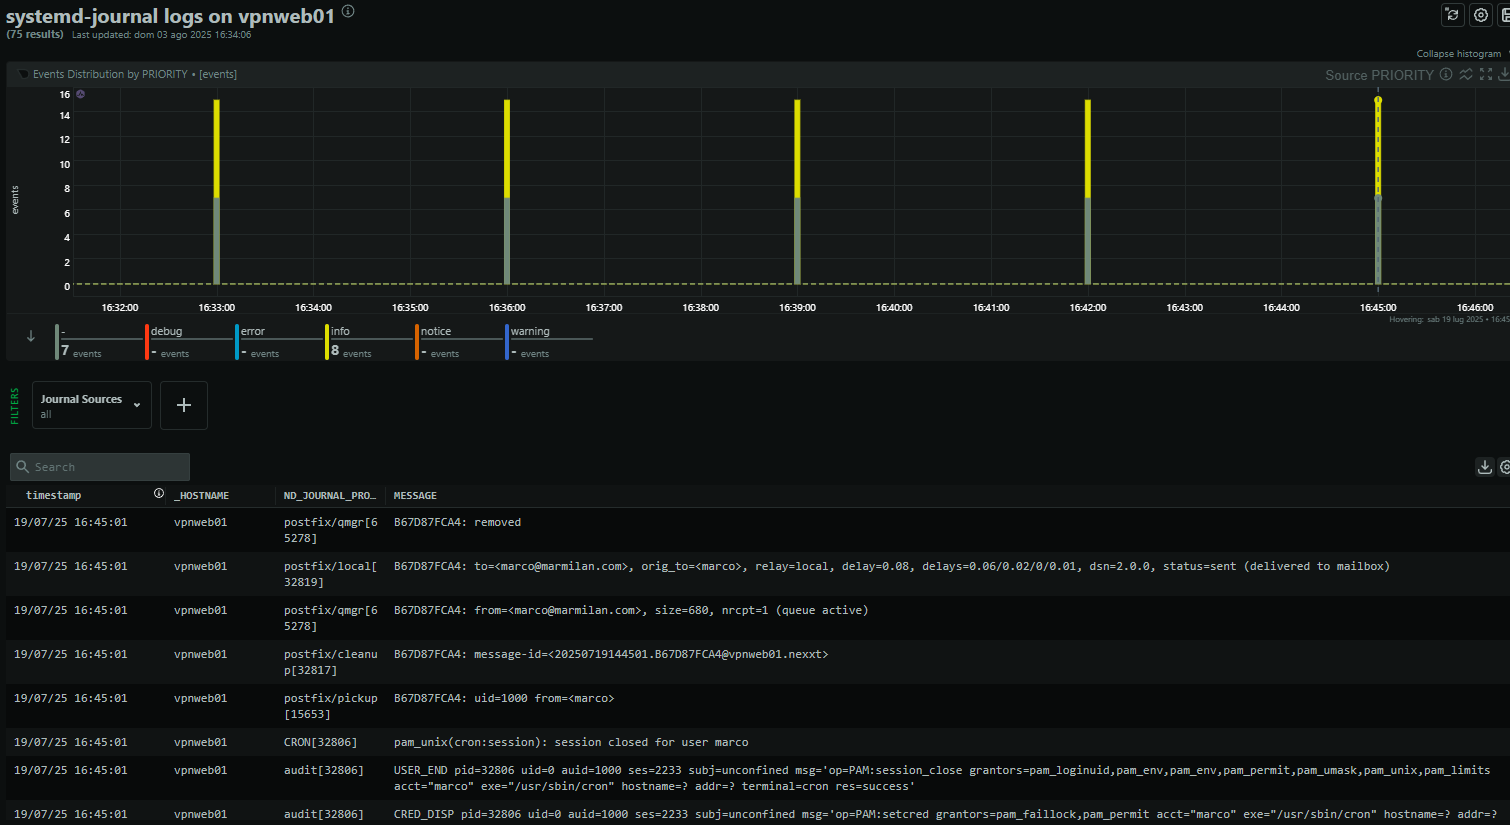
Real-time logs with severity grouping, useful for debugging cron jobs or catching failed services.
Common Use Cases
- Identify services causing I/O bottlenecks
- Detect memory leaks before swap kicks in
- Track container sprawl and underutilization
- Monitor background job execution via logs
Final Considerations + Discount
Netdata is fast, efficient, and immediately valuable. It brings observability to environments that often lack it — especially in edge, small-team, or multi-node setups.
It’s open source, but Pro plans offer extended retention, SSO, team management, and role-based access. If you're considering upgrading, here’s a referral link for 10% off:

More info: https://www.netdata.cloud/